The business
Discounted
Piotroski 6/9, clean books, realistic DCF +83%
GemstonePortfolio reads the evidence underneath a crash: whether the business still stands, whether the selling is running out, and whether it is being absorbed, trade by trade. Then it tells you where that evidence stands, including when the honest answer is not yet.
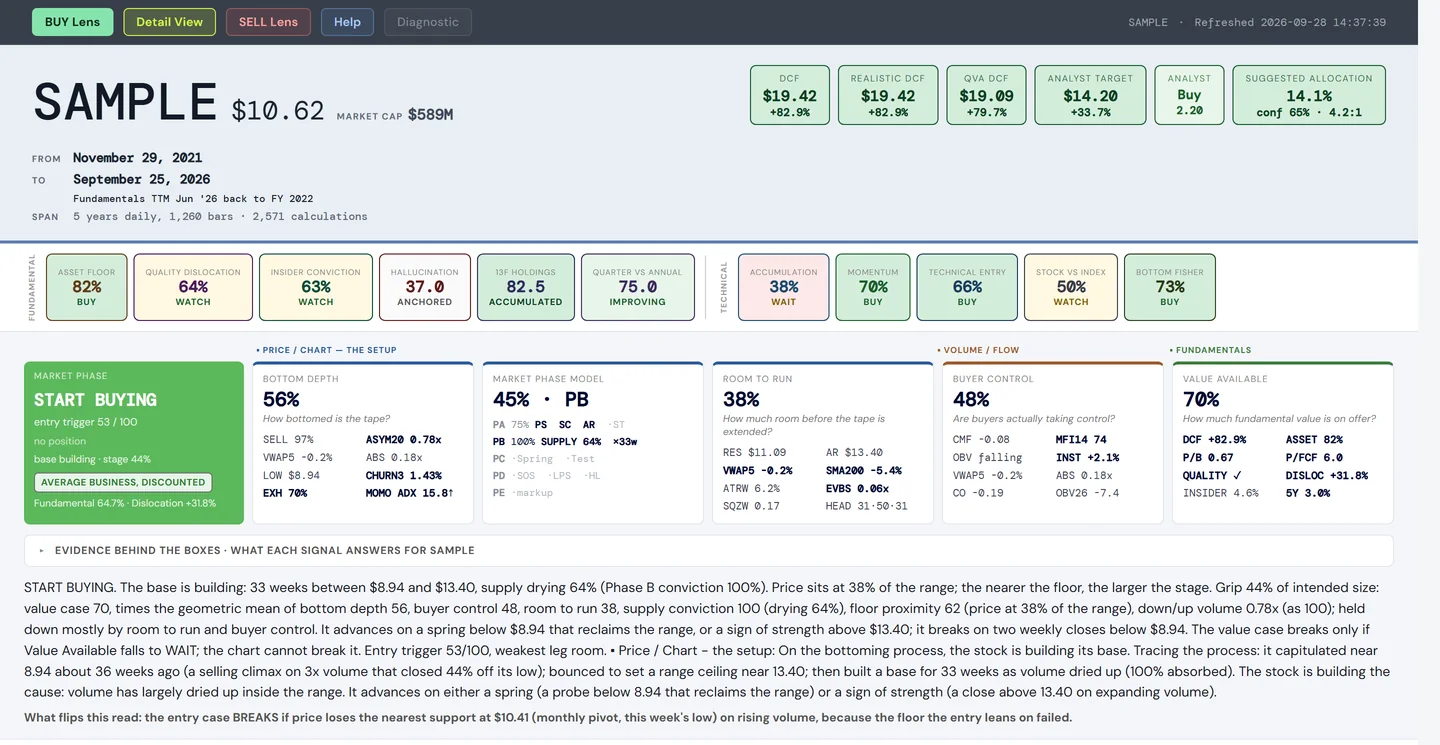
One company, read three independent ways, then weighed into one verdict. SAMPLE is an invented company; every screenshot on this page is the real system run on its generated data.
Nobody lands on a page like this by accident. Something happened to a stock you own or watch. Here is what the system answers for each of the usual reasons.
Scores and ratios are everywhere, many of them free. This is what sits on top of them, and it is where the decision is actually made.
The system does not guess where a falling stock will stop. It measures the transition, stage by stage, and shows you which stage the evidence supports.
Most traders buy at stage 5, when demand has visibly returned: the breakout, the strong close above the ceiling, the chart that finally looks safe. By then the stretch from the floor to the ceiling has already been travelled without them, and the point that proves them wrong now sits a long way below their entry.
Take SAMPLE's own levels: a floor at $8.94, a ceiling at $13.40, and the price at $10.62 inside the base.
| The move up to the $13.40 ceiling | +26% ahead of you |
| Distance to the $8.94 floor that breaks the case | 16% below |
| What you are waiting for | evidence, not the crowd |
| The move from $10.62 to the ceiling | +26% already gone |
| Distance to the same $8.94 floor | 33% below |
| What you are buying | confirmation, at a higher price |
No subscription, no dashboard to babysit. Pick the company, pick the depth.
A cheap price proves nothing. The first question is whether there is still a business underneath it.
Company Detail opens with the price inside its five-year and 52-week range, the three forensic scores, and three written blocks that read the page for you: price and tape, the business, and value, risk and outside view, from the realistic DCF to insider filings, shelf registrations and analyst ratings.
Five pass/fail cards answer the first questions a careful investor asks, each with the numbers that decided it: financial health, price dislocation, seller exhaustion, capital protection and earnings quality.
On SAMPLE: an Altman Z of 2.67 in the grey zone, Piotroski 6 of 9, clean books, earnings backed by cash, the price at 3% of its five-year range.
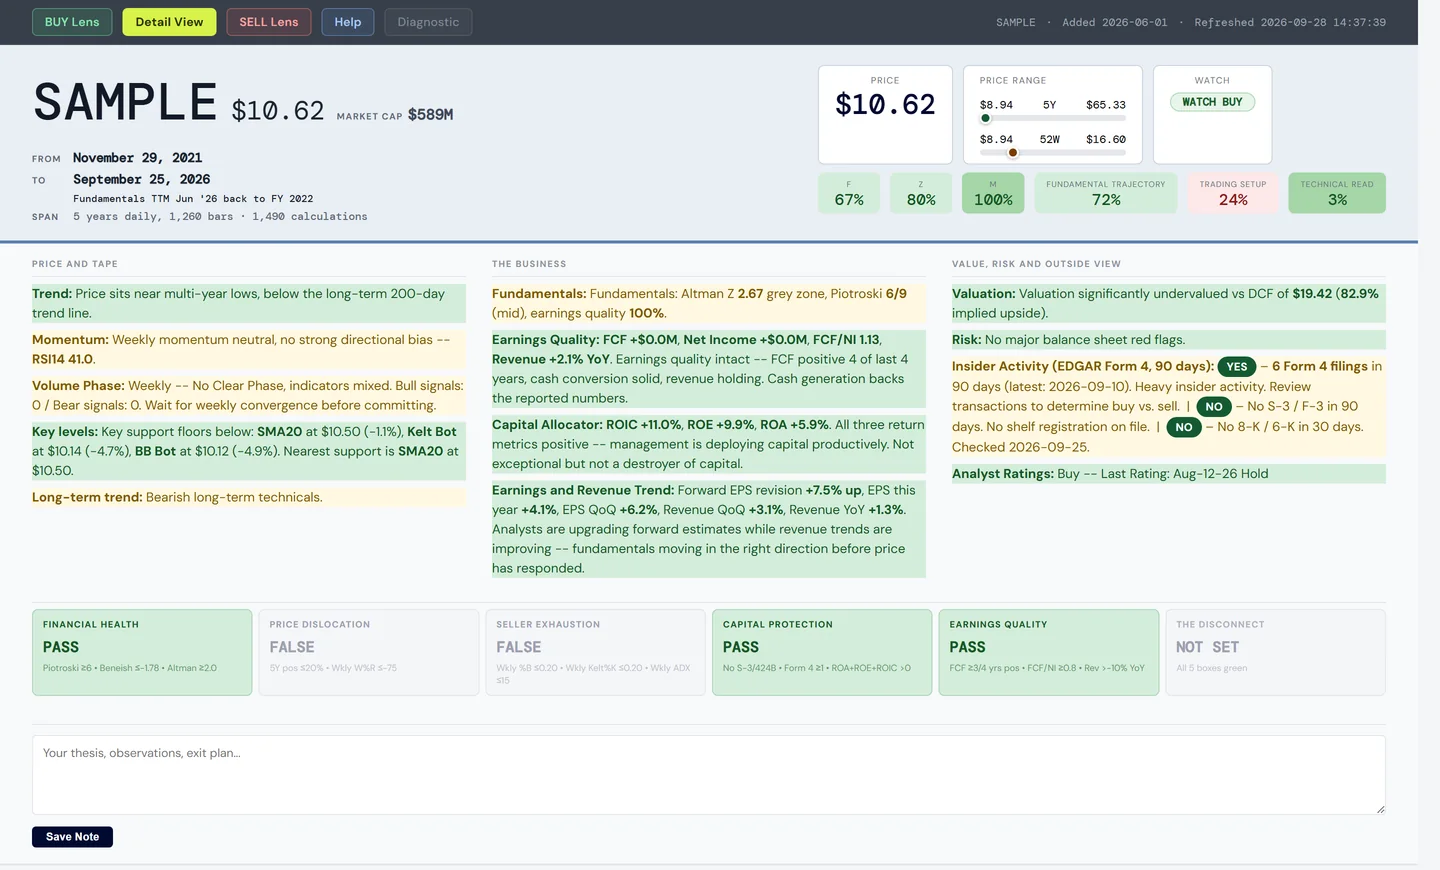
The real Company Detail header on SAMPLE.
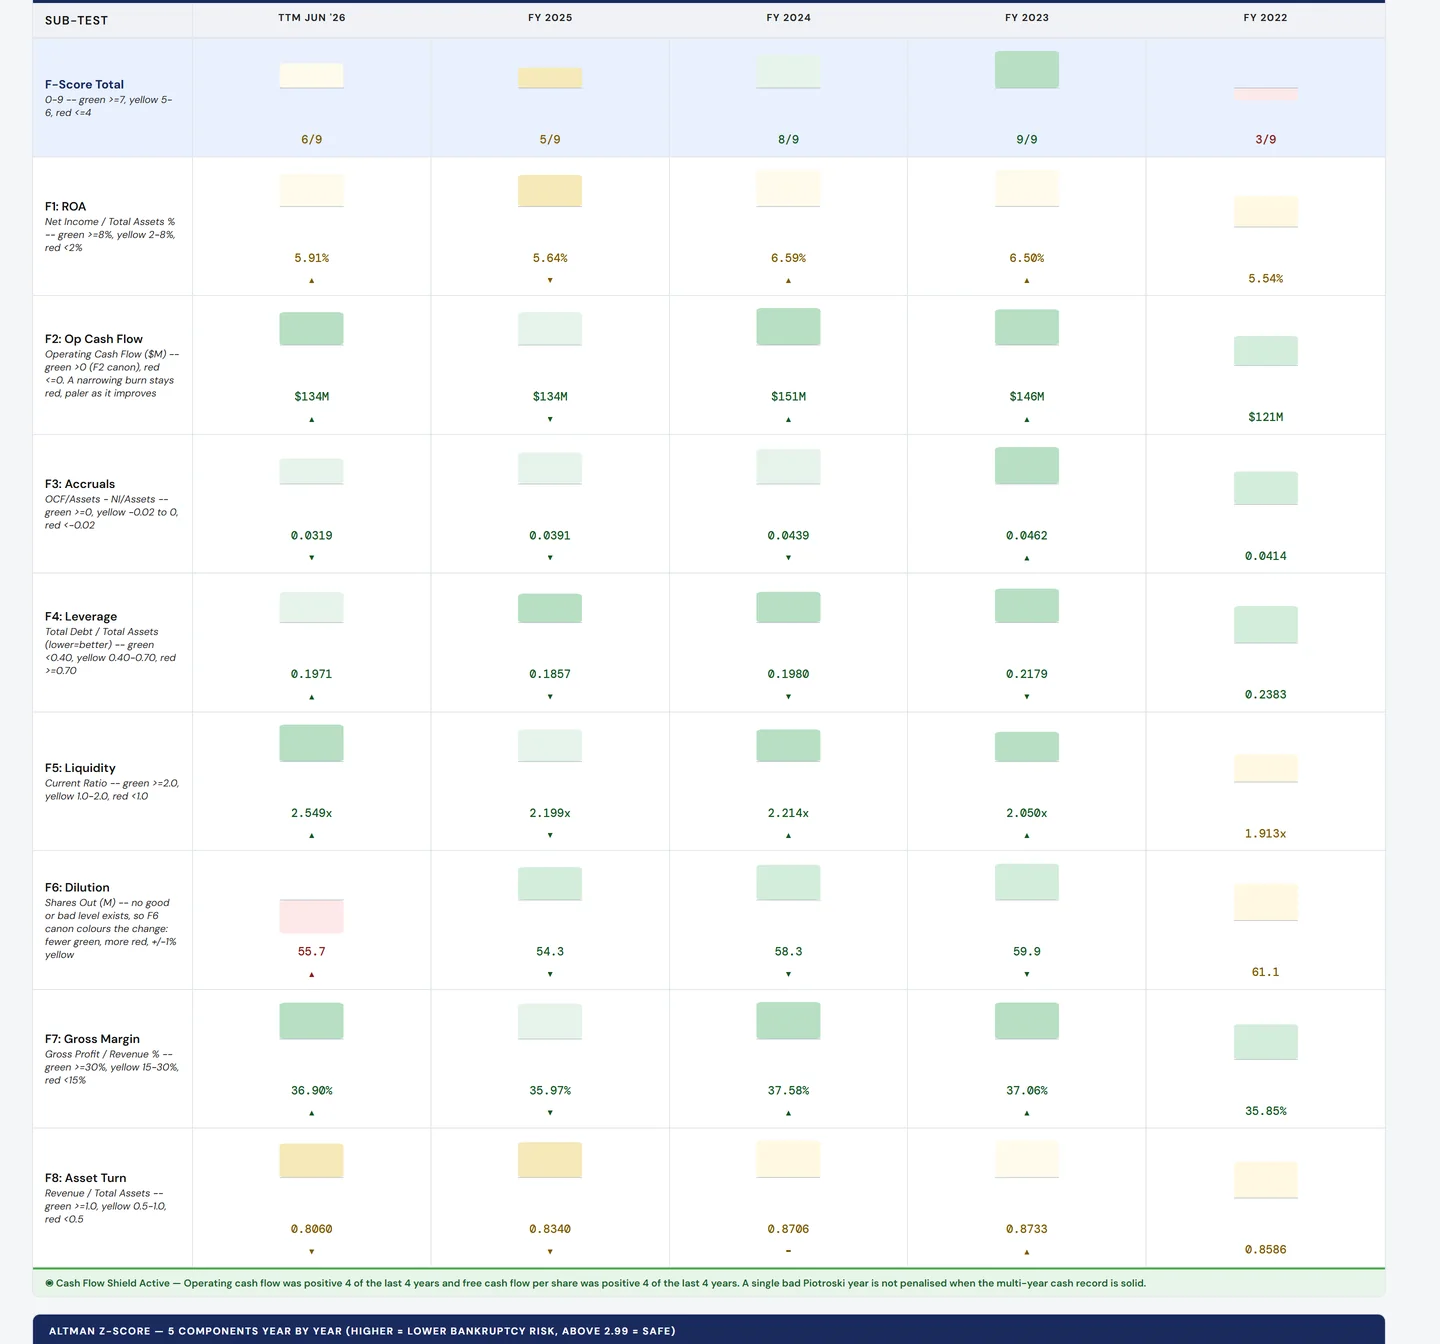
Every Piotroski sub-test on SAMPLE, five years side by side. Good grows up from the middle line, bad grows down.
A score shown for this year only hides the year the trend turned. Here the sub-tests are drawn for every one of five years: eight of Piotroski's nine tests of financial health on their own rows, Altman's five bankruptcy components, and all eight of Beneish's manipulation indices, including TATA, the gap between reported profit and the cash actually generated.
Each cell is coloured by its level and marked by its direction, so a healthy reading that slipped, a weak one that is improving and a weak one getting worse all look different. The last one is exactly what the page is built to surface early.
Twelve more five-year rows: net current asset value, the Graham Number, price to free and to operating cash flow, the realistic DCF upside, return on capital after tax, gross and net margin, revenue, free cash flow per share, debt to equity and the quick ratio. 33 rows in all.
Where a ratio has no meaning it says so: a negative free cash flow leaves no multiple, negative equity leaves debt to equity undefined, and a price below net current asset value, the classic Graham net-net floor, gets a banner of its own.
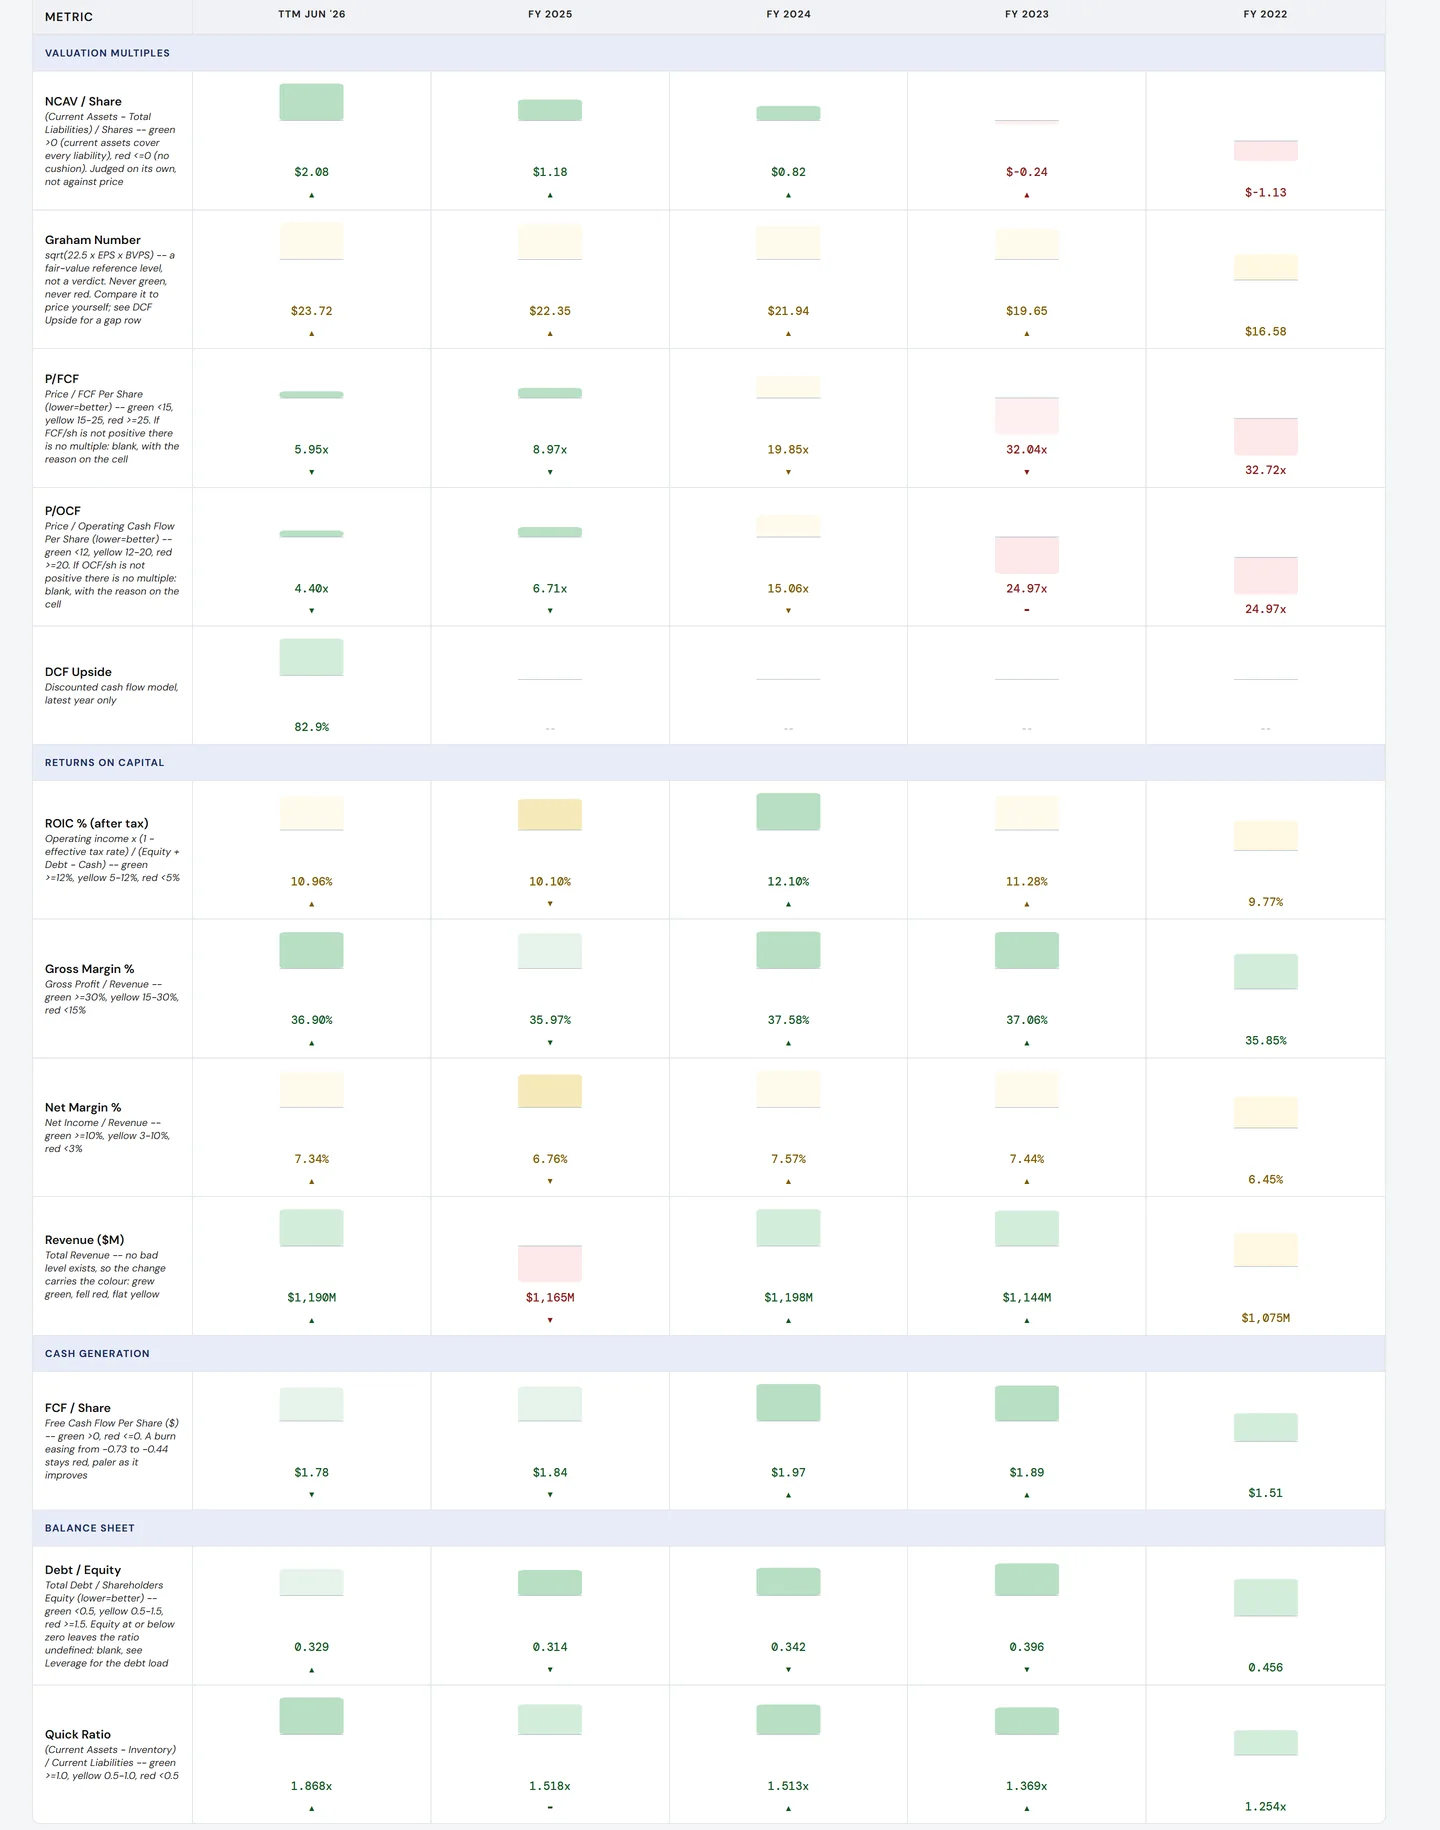
SAMPLE's fundamental trajectory, the latest twelve months on the left.
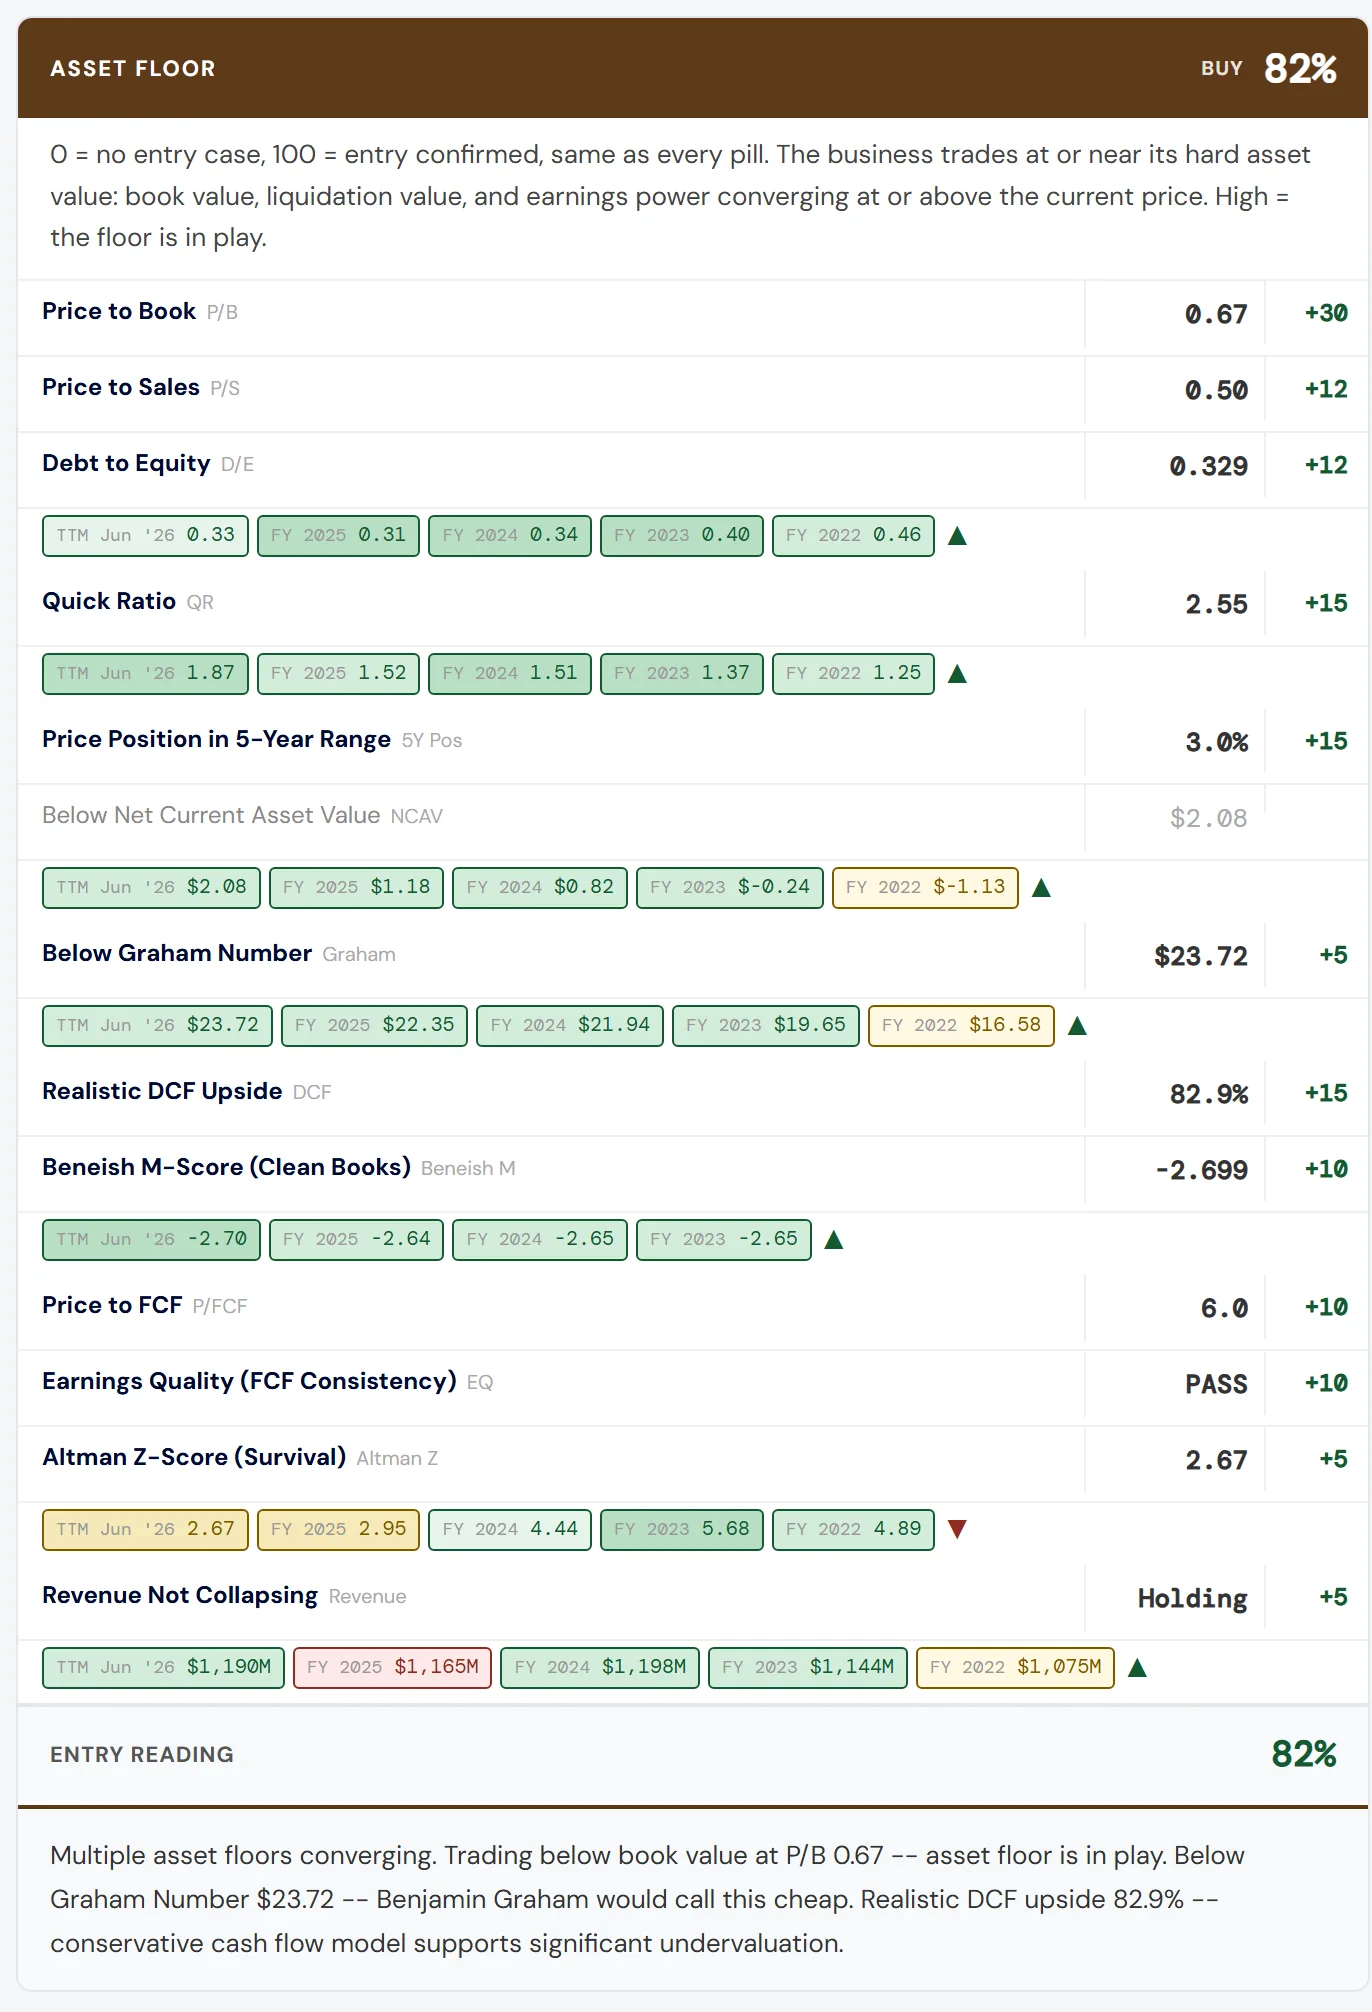
The Asset Floor lens on SAMPLE, every row with the points it earned.
In the full system, three fundamental lenses decide whether there is a business case at all: Asset Floor (book, liquidation value and earnings power against the price), Quality Dislocation (a sound business the market has not caught up with) and Insider Conviction (the people closest to it, and whether the share count is shrinking or being diluted).
Without a value case, the verdict is Not yet, however good the chart looks.
The Hallucination view reads nothing but the company's own price history and its own statements. No peer group, no analyst target, no sentiment. It scores how far and how abnormally the price moved (40 points), the gap between price and business (20), and whether the statements still agree with each other (40): do gross profit, operating income and cash flow move with revenue, does the physical base keep up, is the margin in line with its own history?
The answer sits on one axis: Punished Anchored Inflated. A punished price on statements that still agree is a discount. A price tracking the fastest line in statements that no longer agree is something else, and the card says which.
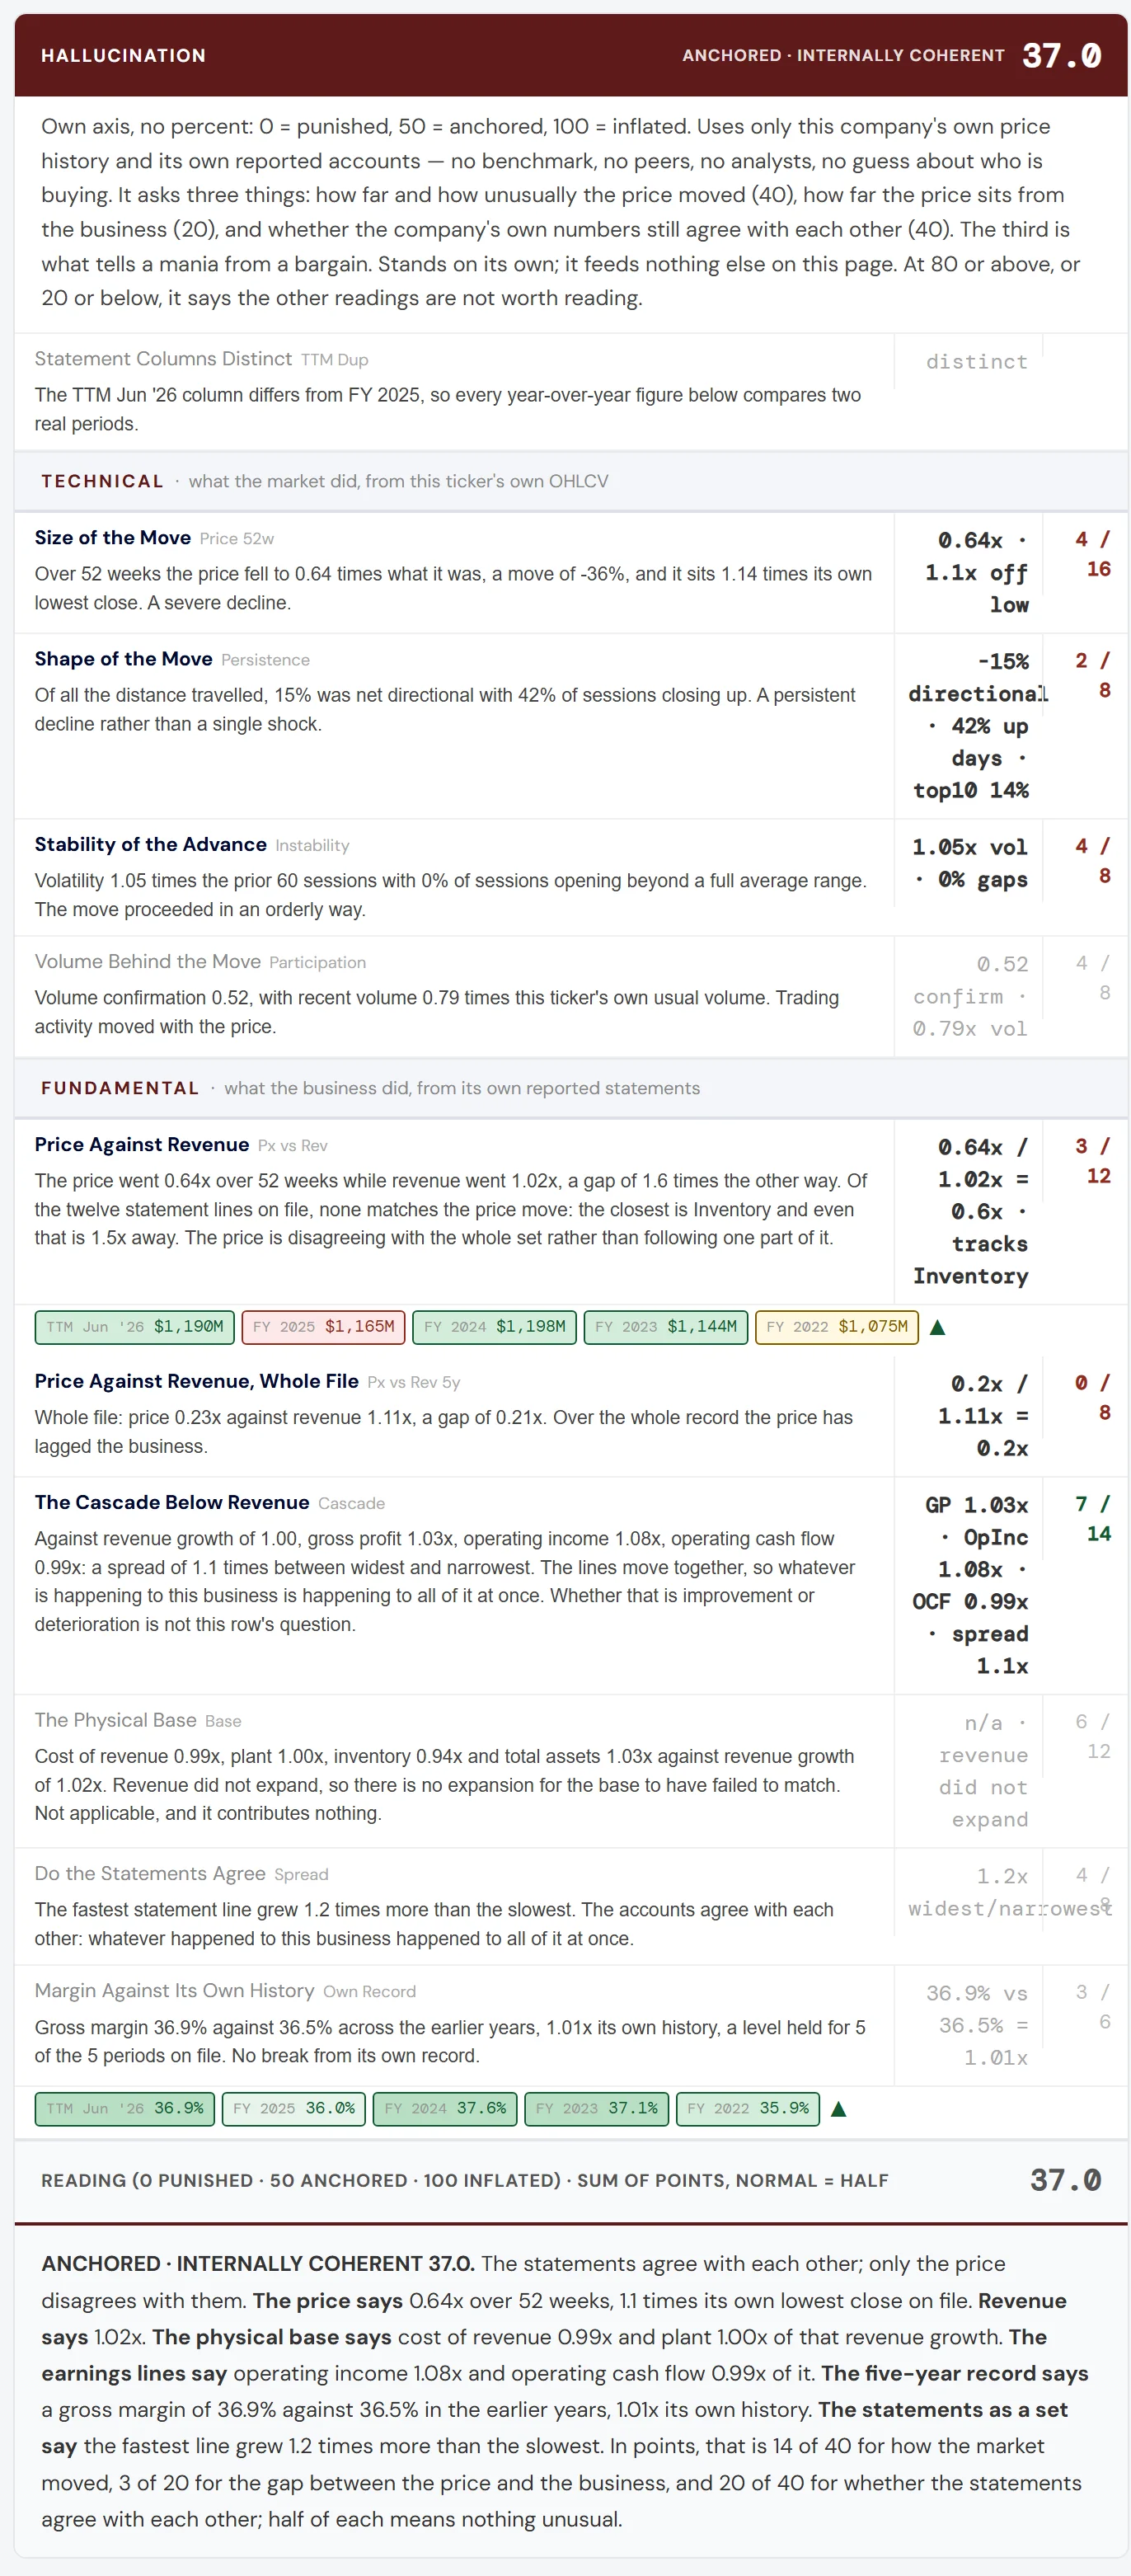
Hallucination on SAMPLE: ANCHORED, 37.0. Price and business tell broadly the same story.
A stock can have a beautiful base and still fall through it. The chart cannot tell you who is taking the other side of the selling. The trades can.
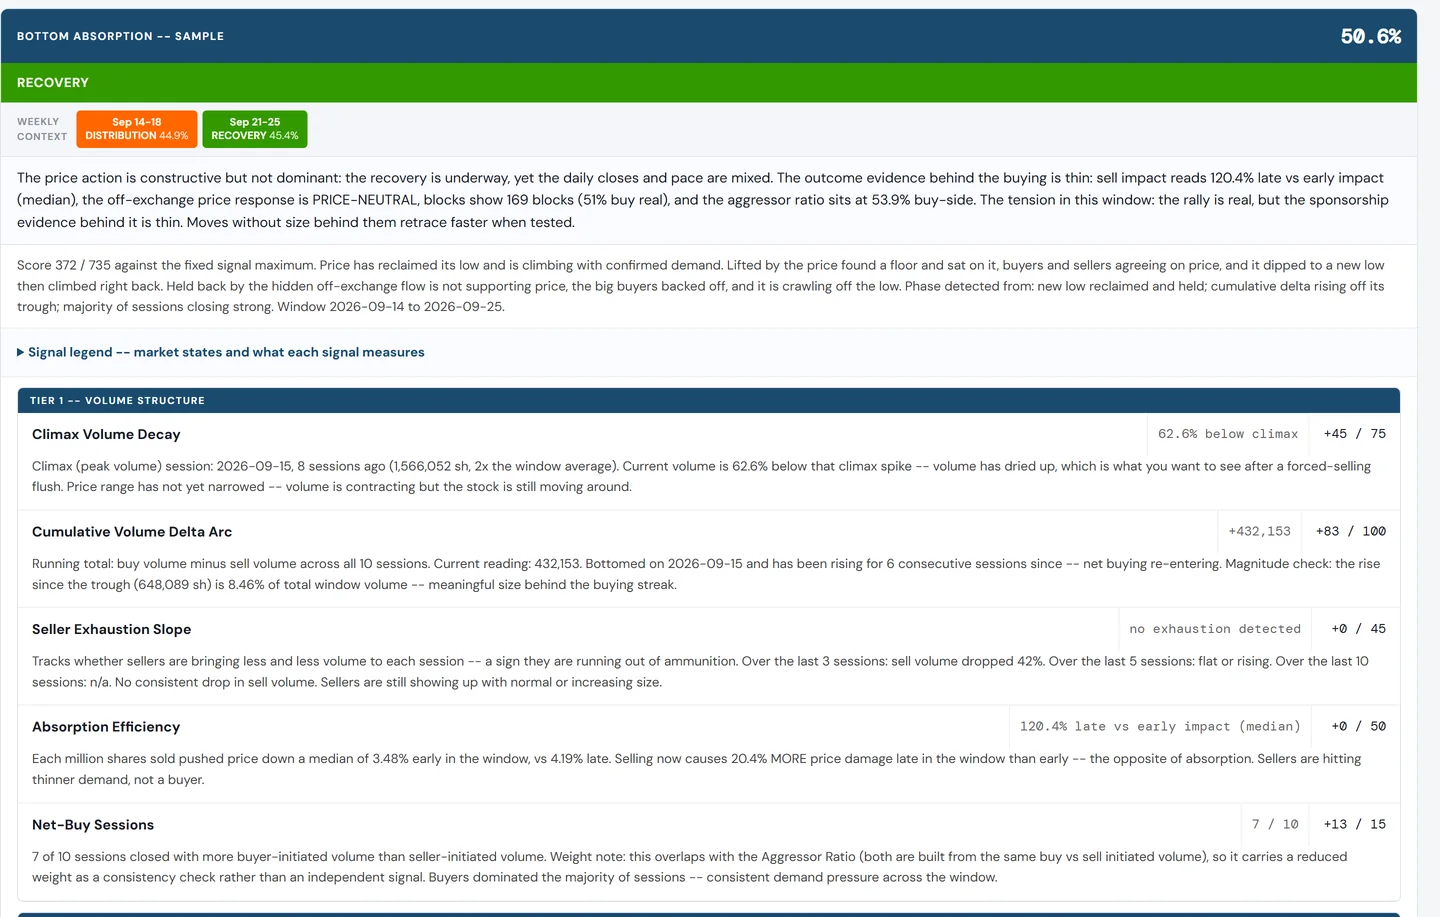
Bottom Absorption on SAMPLE's invented two-week tape: RECOVERY, 50.6% of a fixed 735-point maximum, after a week of DISTRIBUTION.
Every other tool works from daily bars: one open, one close, one volume. Bottom Absorption pulls every individual trade in the window, tens of thousands in a single week, up to 118,780 so far, and asks what daily bars can never answer: what did the selling actually accomplish?
If heavy selling keeps producing lower prices, sellers are still in charge. If the selling keeps coming while price stops falling, the same low holds, sell volume shrinks, buyers step in and a new low is reclaimed, the selling is still there but becoming less effective. That is absorption, and it is what the page is built to detect.
Nothing guesses at intent. Every panel states an observable fact, then classifies it by what price did next, and where it cannot tell it says PENDING rather than inventing a number.
The score measures how much evidence accumulated. The state is detected separately, from specific clusters of conditions: CapitulationBreakdownDistributionLate momentumMarkupRecoveryAbsorptionBase buildingMixed.
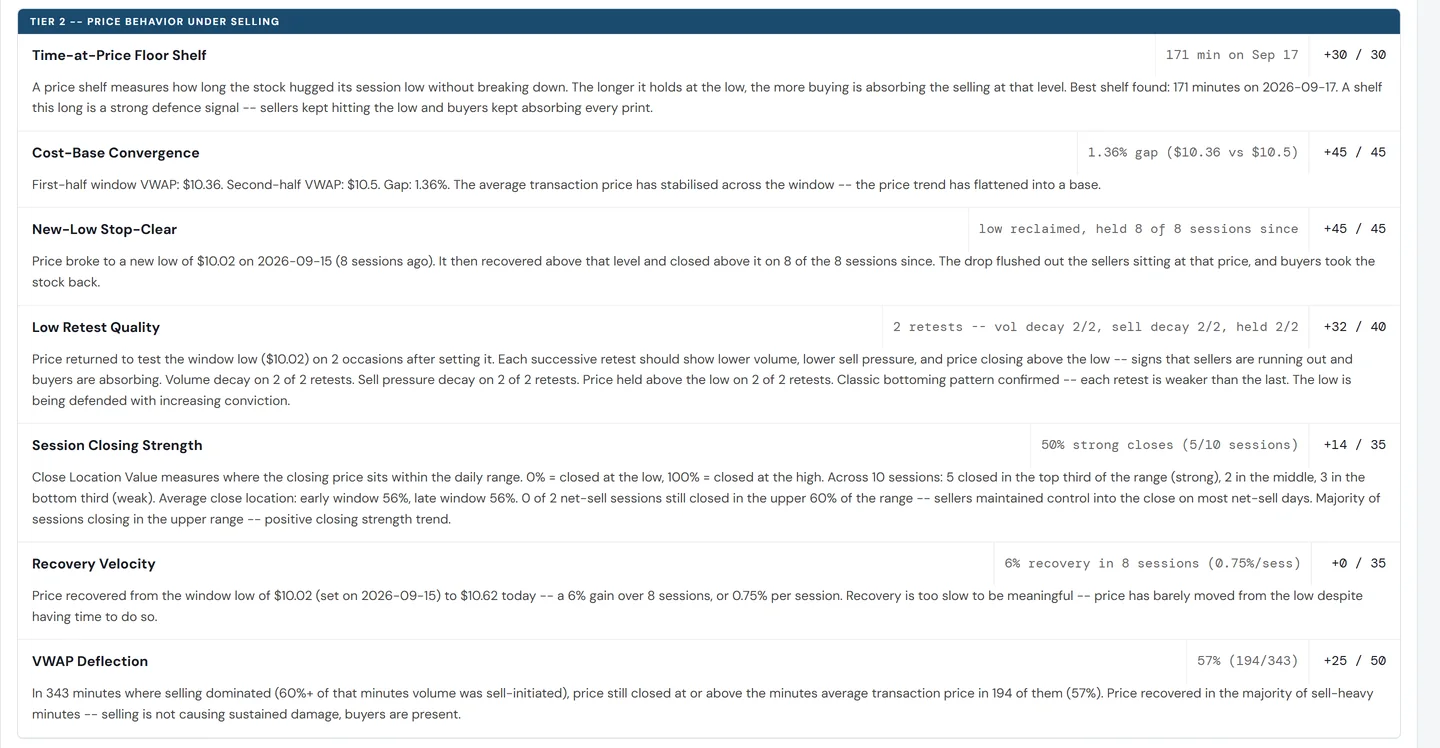
Tier 2 on SAMPLE: the $10.02 low reclaimed and held 8 sessions of 8, two retests, each weaker than the one before.
Its own summary: the rally is real, but the sponsorship evidence behind it is thin. That is not a failure of the system. That is the information.
Hold the stock and the Buy Lens speaks in a holder's voice: Thesis breaking when the value case is gone, Hold when the case stands and no stage is due, Let this leg cool, Let it run, and Add only when a test has held, a spring has printed, or price is at or below your own entry inside a structure that allows it. A bottom fisher adds lower or on evidence, never higher on nothing.
Two slower panels ask what happened afterwards: after a heavy off-exchange day, did the dips get shallower or deeper? After every large block, did price trade above it one, three and five sessions later, below it, or neither?
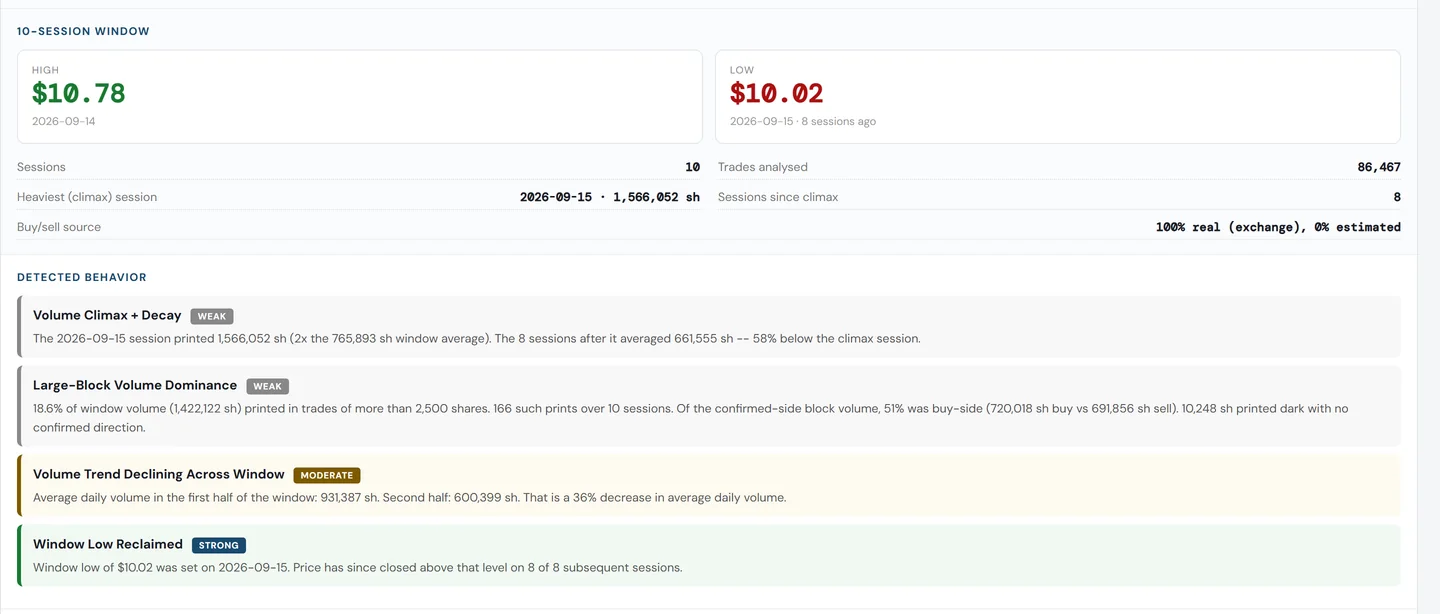
Detected behaviour on SAMPLE, each pattern tagged STRONG, MODERATE or WEAK.
A bounce is not a bottom. What matters is where the move sits in the structure of a base, and how much room is left.
The Buy Lens on SAMPLE: START BUYING, entry trigger 53 of 100, base building, stage 44%.
One vocabulary of 37 named measurements runs through all five, each with its window in its name. Open the evidence panel and every signal says where it was computed, what it scored there and what it means for this company today, followed by what this is, what this is not and the weaknesses that are real.
The entry trigger is a confluence of value, bottom depth, the turn in the structure and room to run, value weighted most. One weak link drags the whole number down: a cheap stock that has not turned and a turning stock that has already run both score modestly.
The phase name is read from what the structure actually printed: Not yetWatch closelyStart buyingBuy nowWait for pullback. If you are late, it says so: once price has left the range, the low-risk entry has passed and the page waits for the pullback that holds.
The grip says how large a stage the situation allows, what flips this read names the price that breaks the case, and Suggested Allocation answers how much: quality against payoff, a quarter of the Kelly result. On SAMPLE: 14.1%, confidence 65%, odds 4.2 to 1.
Read on the weekly chart, from the price series itself. The capitulation is the week of greatest volume and spread at a genuinely new low; the ceiling is where the first rally tops out; the floor is the lowest price defended in between. A breakout is measured against the base's own typical week, never against the panic. Events that fail are cancelled, and two weekly closes below the floor cancel the base.
| Step | What it means | Events the model looks for |
|---|---|---|
| PA · Stopping the downtrend | The fall is arrested. A heavy, wide week marks the panic low; a rally off it sets the ceiling. | PS preliminary support, SC the capitulation, AR the first rally, ST a quieter retest |
| PB · Building the cause | Sideways inside the range while supply is absorbed. A base is time spent absorbing the decline. | SUPPLY drying against the panic; weeks contained in the range |
| PC · The test | A final shakeout under the floor that fails to attract sellers. | Spring, and a quiet test of that low |
| PD · Trend within the range | Demand has taken the ceiling and holds above it. | SOS, LPS, higher lows |
| PE · Trend outside the range | The base is behind; price is trending. | markup against the height of the base |
Buying is the easy decision. Most people sell too early out of fear, or hold too long out of hope.
Five boxes: Price Stretch (how far price has run across daily, weekly and monthly candles), Trend (how close the move is to its exhausted end), Seller Control (the same four money-flow measures, read from the selling side), Market Pressure (heavy volume that moves price very little, the classic sign of distribution) and Value Remaining.
The exit trigger weighs the core stretch-and-overbought reading most, then two distribution signals built to catch large holders selling into strength, and lightest of all the fundamentals, as the tie-breaker. For a position you hold it resolves into five phases:
HoldingWatchingSell into strengthScaling outSell now
Real value still left on the table keeps a stretched stock at Scaling Out rather than a full exit. A system that cries wolf on every red day is worse than no system at all, so the bar is deliberately high.
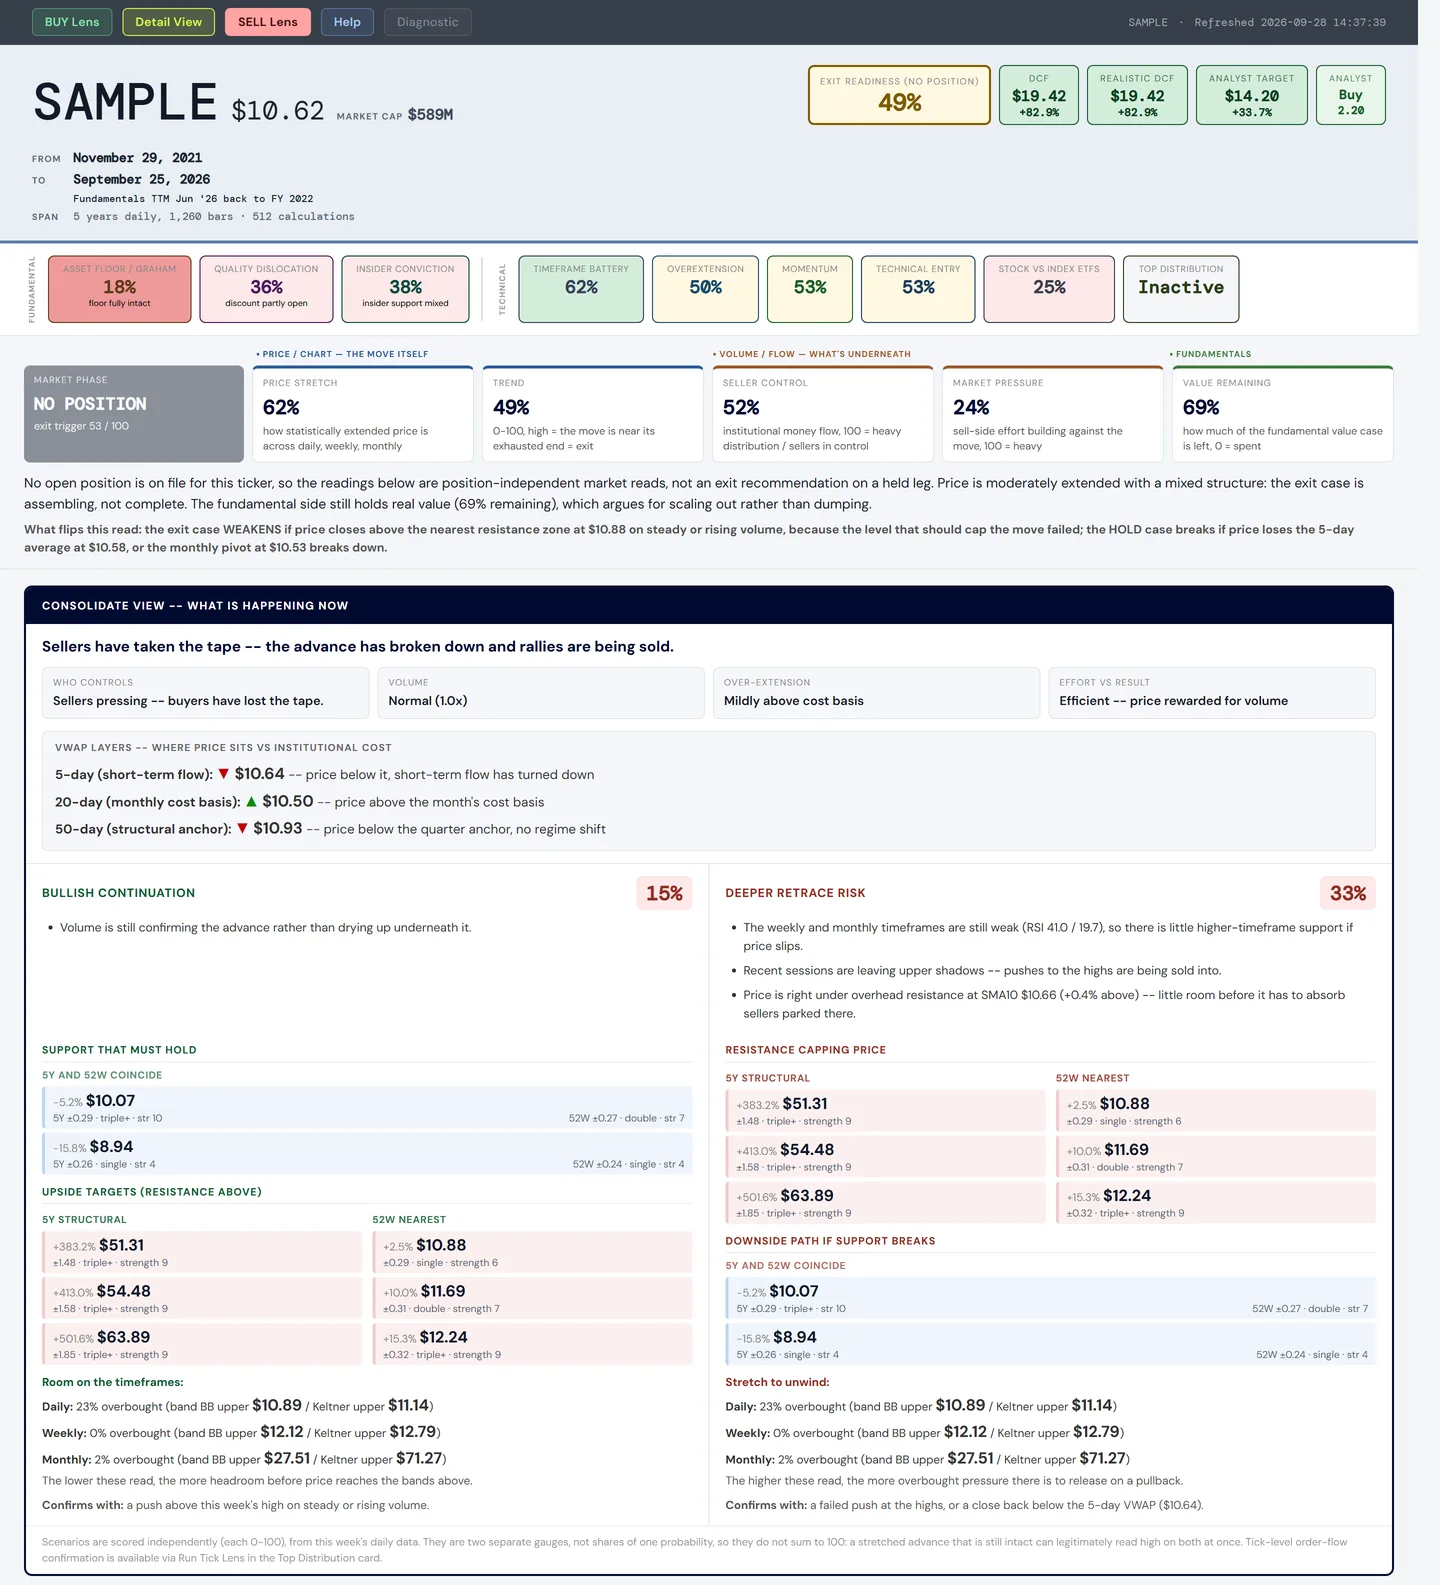
The Sell Lens on SAMPLE: no position held, exit trigger 53 of 100.
"Institutions are buying" means nothing if it is an index fund rebalancing. And an annual report can already be out of date.
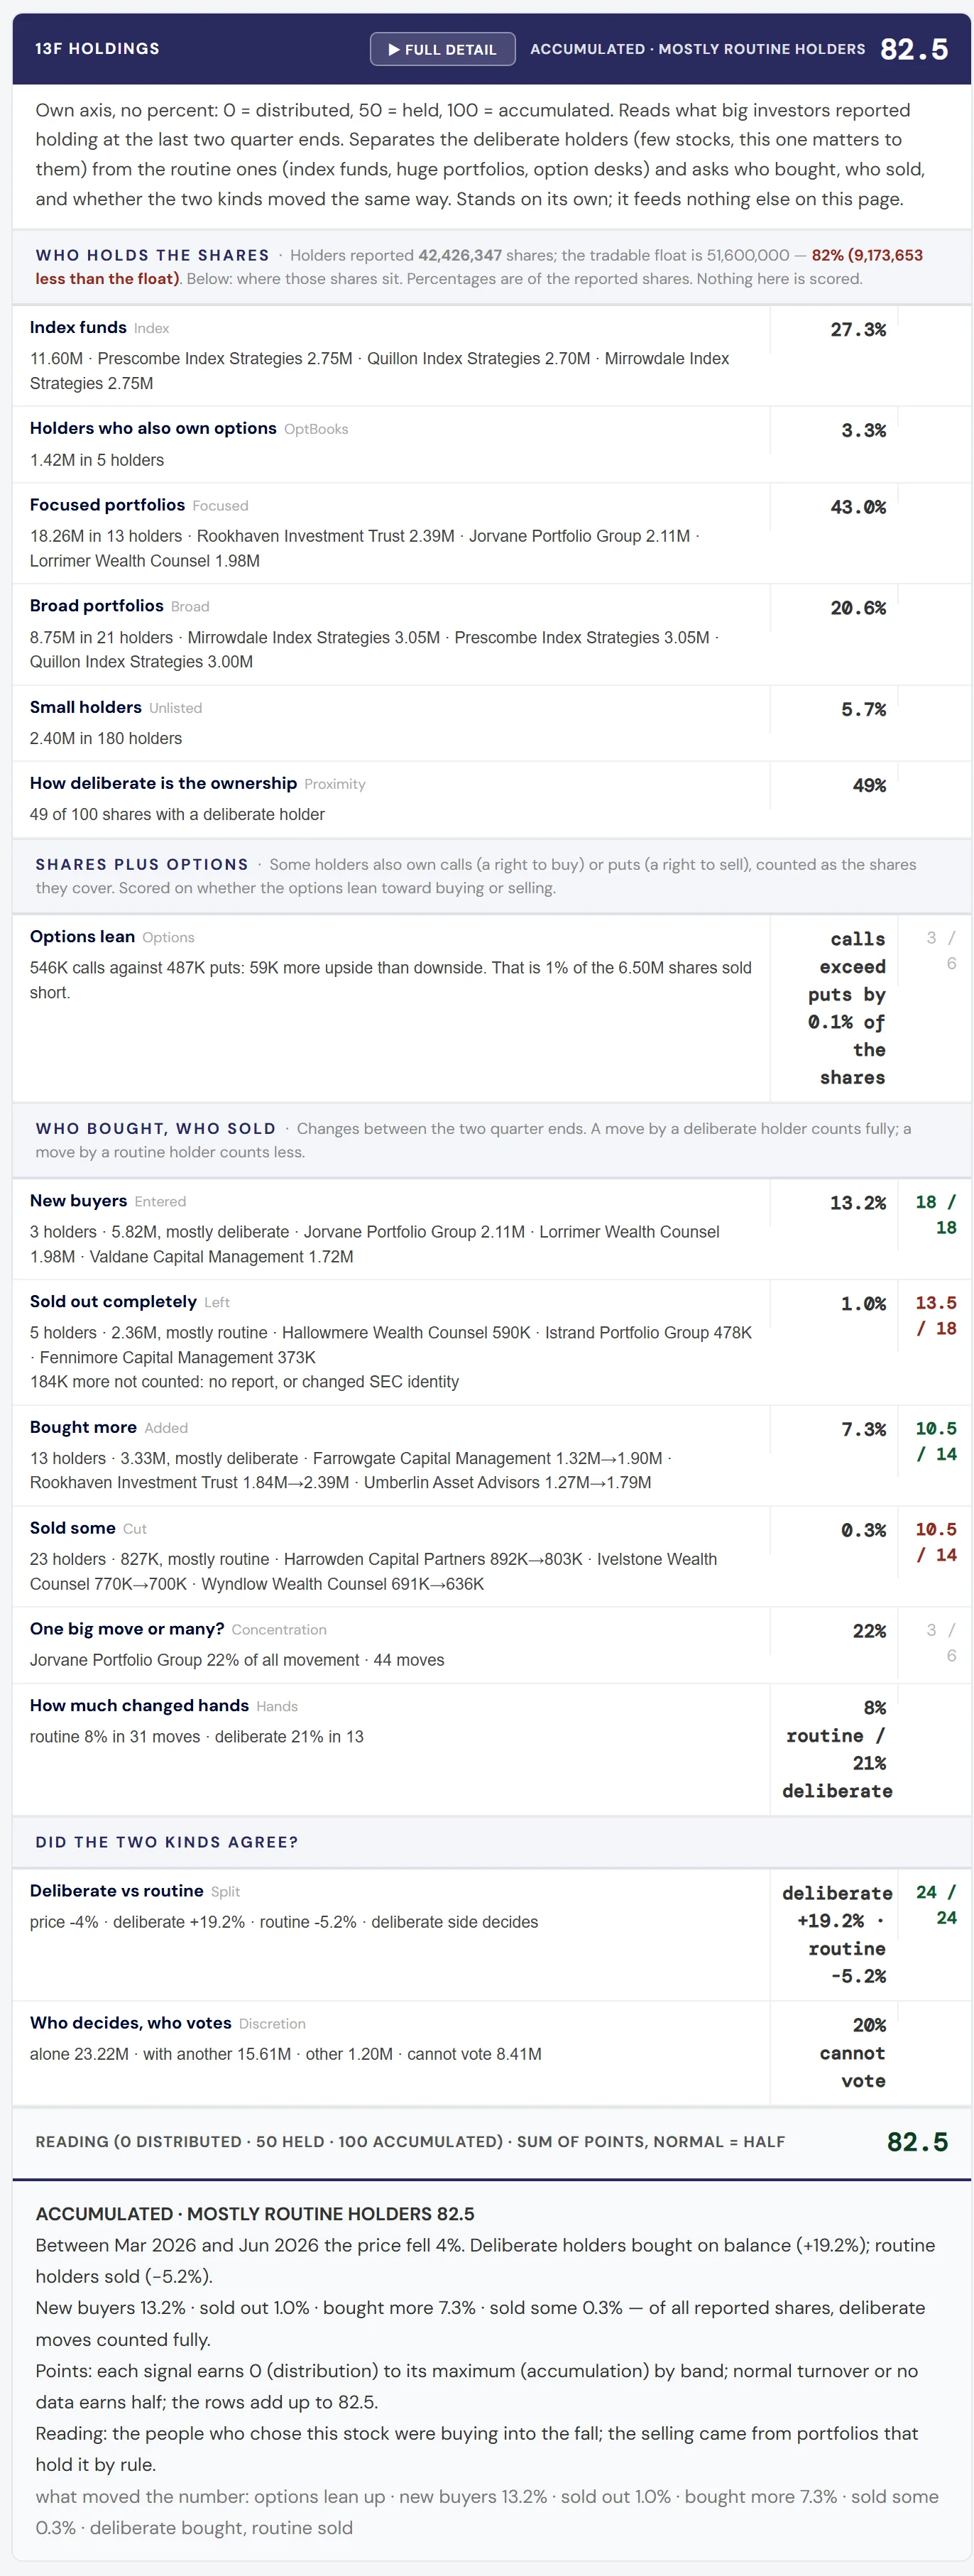
13F Holdings on SAMPLE, every holder name invented: ACCUMULATED, 82.5.
Four times a year every manager running more than $100 million reports its holdings to the SEC. This view prints only what is in those reports, and scores every holder for how deliberate its position is, from four things the report discloses: index funds inside the holder, options in its book, how much of its portfolio this stock is, and how many stocks it holds. Forty is a choice; twenty thousand is a rule.
Then: who holds the shares, who bought for the first time, who sold out, who added and who trimmed, which way the options lean, and the row that weighs most, did the deliberate holders and the routine ones move the same way? A manager that changed its SEC identity is matched, not read as a sale and a new buyer.
Almost every number rests on annual statements and a trailing-twelve-month column that can still carry quarters most of a year old. Quarter vs Annual compares the latest quarter with the same quarter a year earlier, on revenue, gross margin, core operating margin, cash conversion, the balance sheet and working capital, each against this company's own usual change.
Nine flags catch the quarters that would mislead: one-off items, one-offs that recur, a pending cash outflow, receivables or inventory running ahead of sales, profit without cash, buybacks on credit, an unreliable derived quarter checked line by line against the SEC's own figures, and restatements. Then it rebuilds the year on the fresh quarters and re-runs the page's own DCF, Piotroski, Altman and Beneish on it.
Together with Hallucination these are three views that give no verdict and feed nothing. That is deliberate: a warning that fed the score would be averaged away. Standing apart, a warning stays a warning.
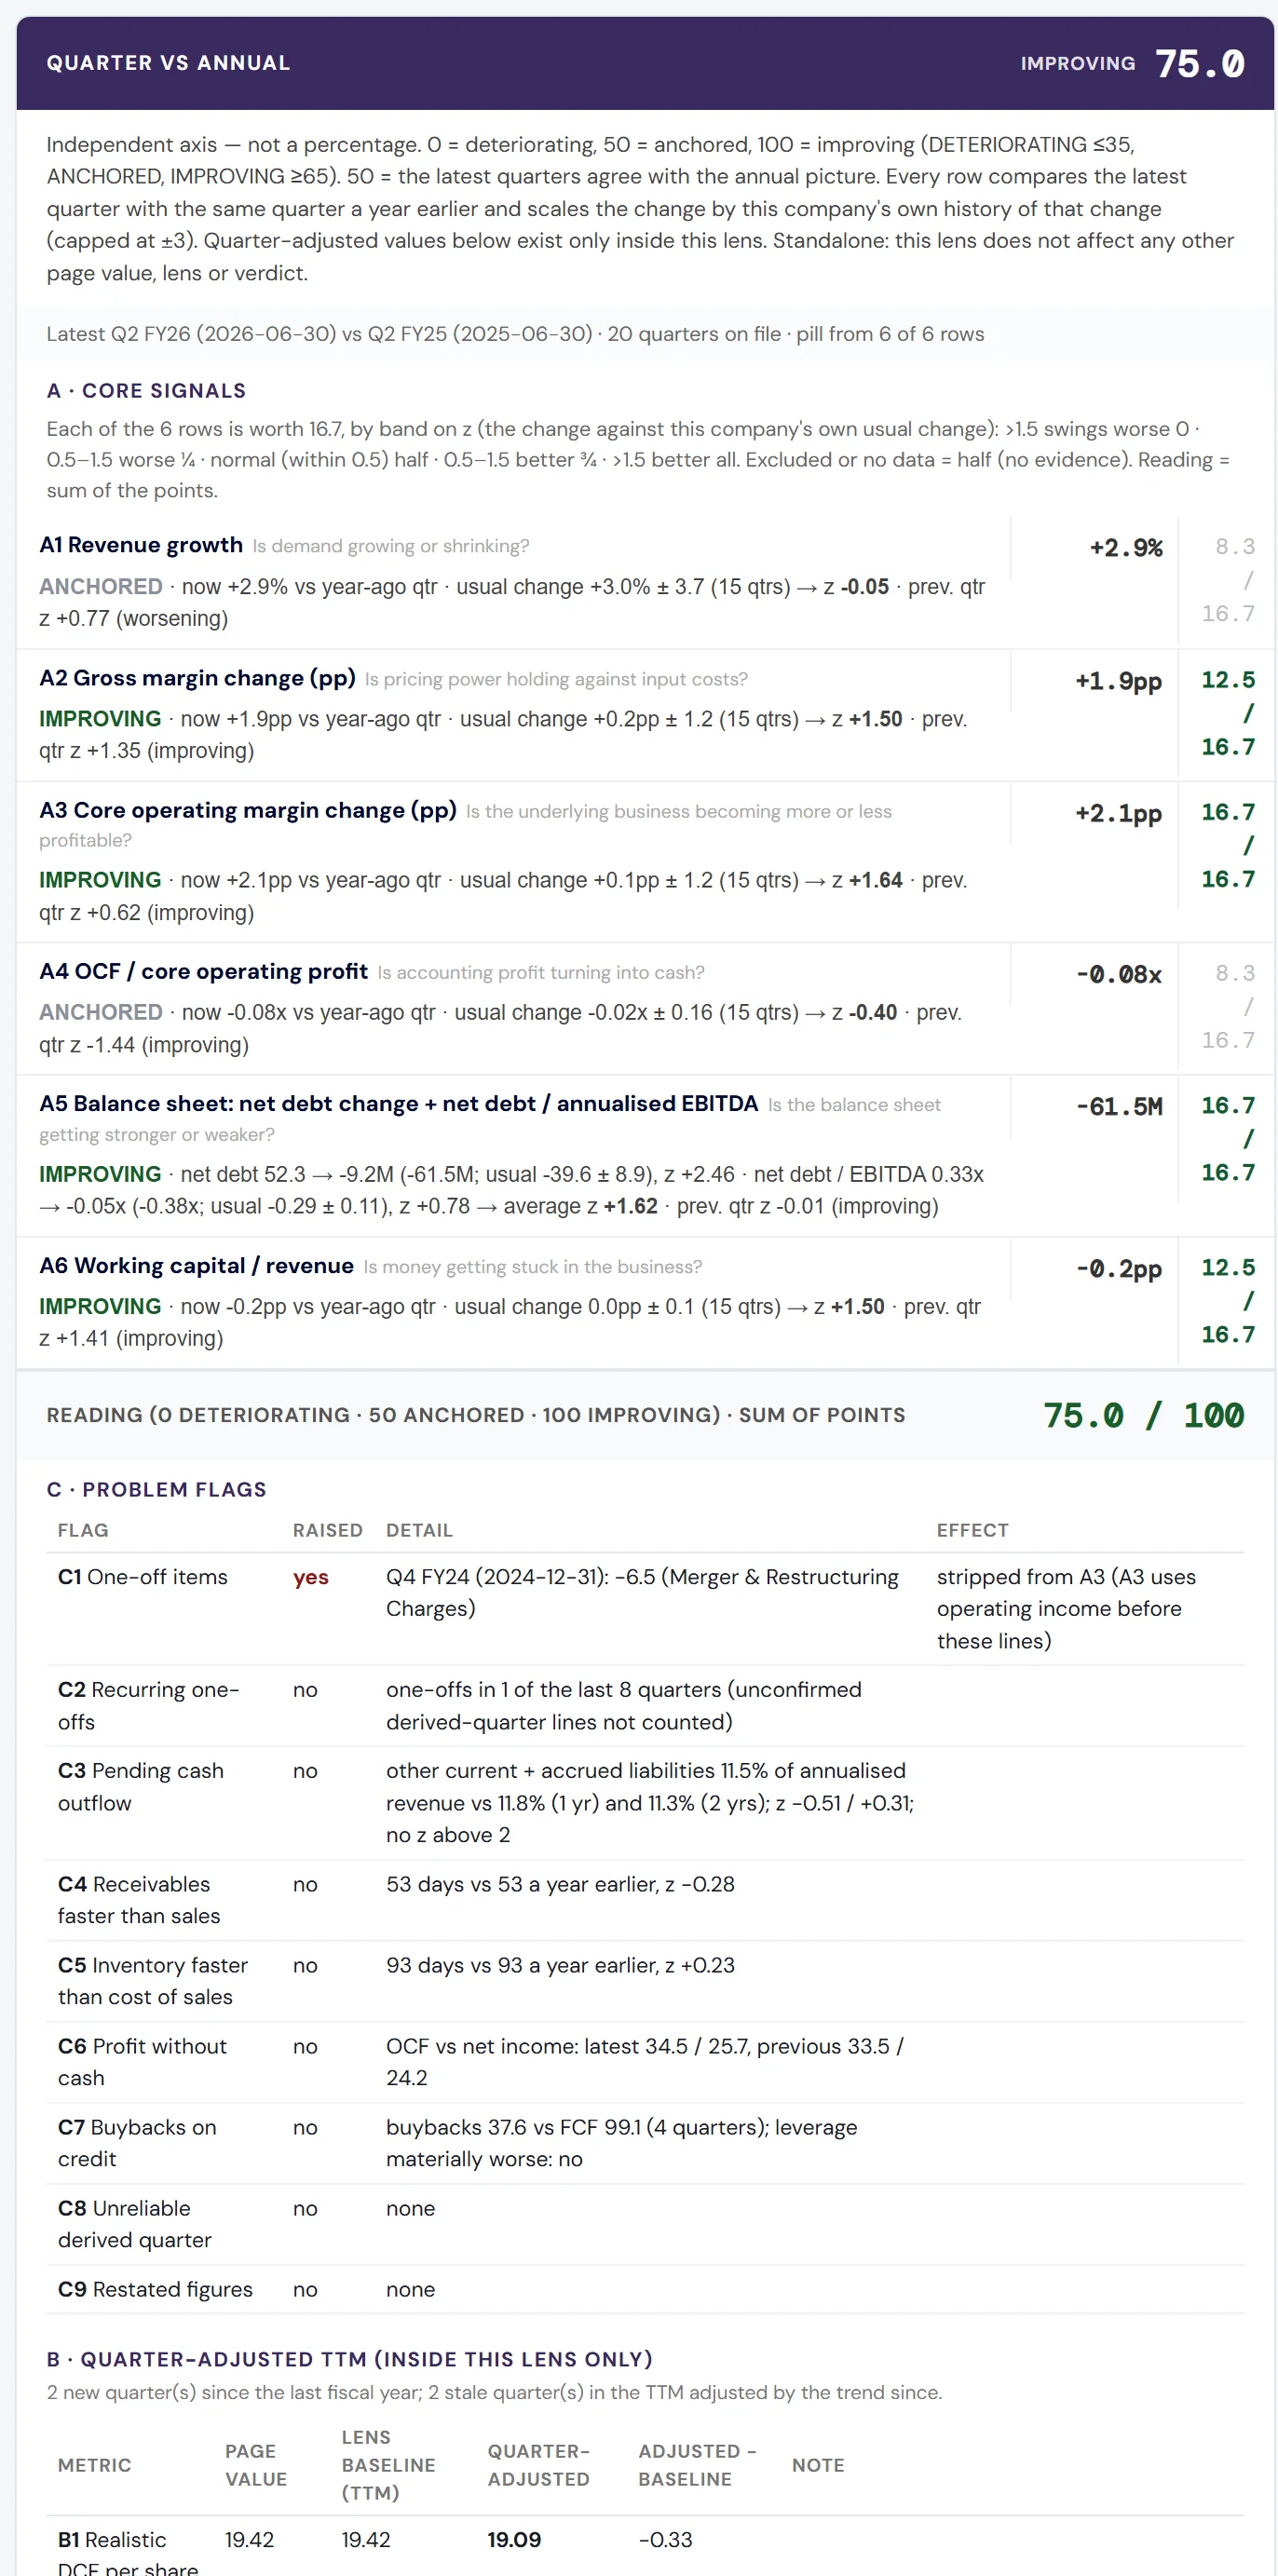
Quarter vs Annual on SAMPLE: IMPROVING, 75.0.
The same trade that works in a broad, healthy market loses in a narrow, late-cycle one.
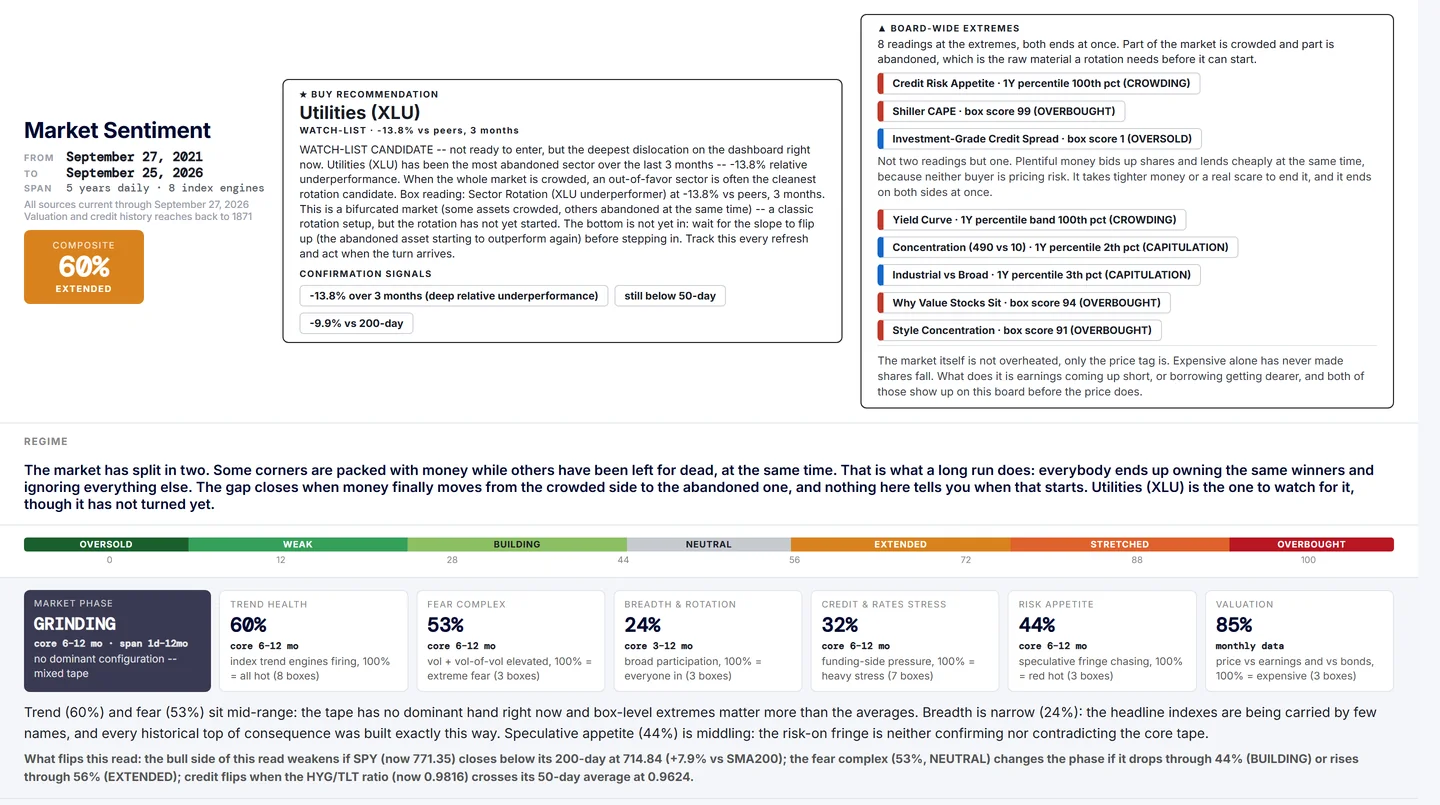
The real Market Sentiment page, with market data as of 25 September 2026.
Most investors never measure the market's mood; they feel it, usually too late, from their own losses. No single vital tells the story, but a fast pulse with falling blood pressure is an emergency. Every box scores its own theme from 0 to 100 and lands in one of seven zones from oversold to overbought, coloured as temperature, not as good and bad, so the eye goes to the extremes.
The structure asks what stage of the base-building process are we looking at? The tape asks what are the actual trades doing right now? They are built from different data and never feed each other, which is what makes their agreement worth something.
On SAMPLE the structure says PB, building the cause, the tape says RECOVERY, 50.6% with deteriorating efficiency. That does not mean buy. It means the stock is structurally inside a base, the transaction evidence is beginning to show features of absorption, and the confirmation is still incomplete.
Confidence comes from convergence, not from one signal
From selling pressure, to exhaustion, to absorption, to a base, to demand returning, to confirmation. The earliest stages offer the greatest asymmetry and the greatest uncertainty, so the system does not hide that uncertainty behind a green button. It shows you where the evidence stands.
Stop asking has it fallen enough? Start asking is the selling exhausted, is someone absorbing it, is price becoming resilient, is demand taking control?
One company, one payment, no subscription.